Time–Cost Integration and Forecasting

Once EVM metrics are in place, the next step is forecasting future performance and estimating final project outcomes.

1. Key Forecasting Metrics
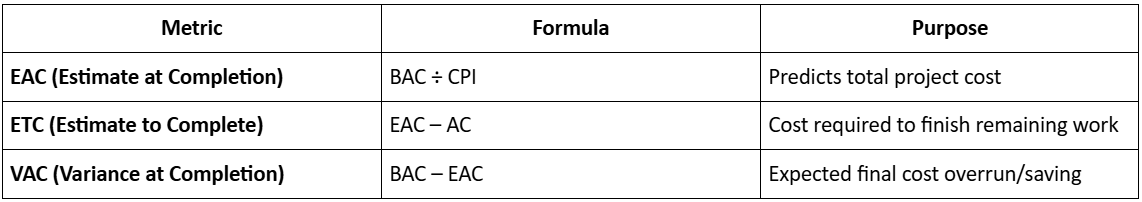
Time–Cost Integration and Forecasting

Example:

If BAC = ₹100 Cr and CPI = 0.9

EAC = ₹100 Cr + ₹0.9 Cr = ₹111.1 Cr

This results in a projected overrun of 11.1%.

2. Time–Cost S-Curves

S-curves graphically display cumulative planned cost, actual cost, and earned value over time.

They allow quick visual comparison of progress trends and performance gaps.

Curve Zones:

  • Early stage: Low cost, low progress.
  • Middle stage: Steep curve (active execution).
  • Final stage: Flattening curve (close-out).

3. Forecasting Best Practices

  • Update EVM weekly or biweekly.
  • Validate progress quantities through site reports.
  • Re-baseline only for approved changes.
  • Analyze trends over time, not just snapshots.
“Forecasting is not prediction—it’s prevention.”

Category: Construction Academy

Subcategory: Budgeting and Planning

Subcategory: Construction Phase

Subcategory: Design Coordination

Subcategory: Estimation Techniques

Subcategory: Initiation and Feasibility

Subcategory: Introduction

Subcategory: Personal Management

Subcategory: Project Close-Out

Subcategory: Project Scheduling

Subcategory: Project Teams

Subcategory: Proposal Management

Subcategory: Total Quality Management

Subcategory: Tracking and Control

Subcategory: Work Breakdown

Category: Help Desk

Subcategory: Client

Subcategory: Construction 101

Subcategory: Contractor Management

Subcategory: Expense

Subcategory: Finance Budget

Subcategory: Inventory Management

Subcategory: My Approvals

Subcategory: Site Management

Subcategory: Vendor Management